Dynamics NAV 2018 Server Reporting Performance

I was recently contacted by a customer who had experienced severe memory leaks on their NAV Server instances. The NAV server instances consumed more than 90% of the available memory on the server and had to be restarted twice daily to prevent the server being overloaded.

After some initial questions about what had changed I discovered that the service instance that was leaking memory was being used as part of a process that scans the boxes in the being packed in the warehouse and prints the invoices.

  1. The box scanning application calls a NAV Codeunit via a Web Service.
  2. The Codeunit posts the Warehouse Shipments.
  3. The Codeunit then prints the Sales Shipment report on the server.

At peak times the NAV Server would be printing 800-1000 reports per hour. Knowing that there have been memory issues with reporting assemblies, I decided to use Performance Monitor to monitor the number of assemblies being loaded by the NAV Server.

Here is the report view of the Performance Monitor log for the NAV Server instance:

NAVCurrentAssemblies

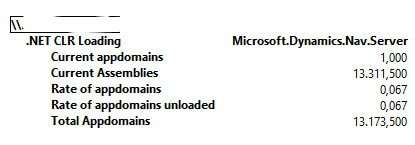
The number of Current Assemblies (13000+) confirmed my suspicions. NAV Server normally has 100-200 assemblies loaded. The Total Number of AppDomains suggested that NAV Server was creating a separate App Domain when running each report and the assemblies generated for the report were not being unloaded after the AppDomain was unloaded.

As explained in the documentation about App Domains and Assemblies , when an assembly is loaded in an App Domain it cannot be unloaded. I figured that the issue was something to do with the way the assemblies are loaded for the reports.

We asked Torben from the NAV development team if he could help us with the issue and he came back with a great answer:

  • Assemblies are generated for each NAV Report object with RDLC that is run on the NAV Server.
  • If the RDLC contains shared variables (this is the case in the Sales Shipment report) then a unique assembly is generated for each instance of the report object. This is to prevent the value of the Shared variables being copied from one report instance to the next.
  • NAV Server is configured by default to run the reports in the current App Domain to improve report performance (speed).
  • The design decision was made to prioritise speed over memory consumption for NAV solutions where reports are run on the client.

In the NAV server the behaviour is controlled by the application configuration setting NetFx40_LegacySecurityPolicy This setting determines if the report is to be loaded in a separate AppDomain. The default setting is True. If you add the setting <NetFx40_LegacySecurityPolicy enabled=”false“> to the Microsoft.Dynmaics.Nav.Server.exe.config file then the NAV Server will to unload the App Domain and the report assembly when the report is completed.

In this case it was better to conserve memory and take the slight performance hit when running the reports. The customer changed the setting and saw an immediate change in the behaviour. Memory consumption was no longer increasing during the day as the memory used for the reports was being released from the server process. Here is the Performance Monitor log report showing that after the change the AppDomains are still being used but the Report assemblies are being unloaded when the reports are completed.

NAVCurrentAssembliesAfter

An alternative solution, if you don’t want to affect all reports is to set the EnableExternalAssemblies Report property to Yes for any report that will be run frequently on the server. This will force NAV Server to run that report in a separate App Domain.

Thanks again to Torben for his help in resolving the issue.


Comparison: Dynamics NAV 2018 vs 2016

After reading a few blog posts about the performance of NAV 2018, I decided it might be interesting to do some comparison runs to see if there were any significant differences. The first caveat here is that these runs are intended to compare the NAV server performance between 2 versions and don’t take into account network bandwidth, latency & database server latency.

The load tests are run against the standard NAV W1 demo application with the initial demo data. I ran the NAV servers on the the same virtual machine using the latest nav-docker images. The NAV Server versions used for the comparison were NAV 2018 CU4 and NAV 2016 CU18.

I ran the NAV Load Test Order Processor scenarios with a maximum load of 50 concurrent users. In the test scenario user creates one or more sales orders with 10 lines. I ran the load test for 10 minutes with approx. 2000 server transactions completed in each test.

The results were not very interesting. After doing repeated test runs the differences are small (< 0.2 sec) and probably not noticeable to the user. Here is an overview.

NAV2018PerfComparison

This comparison does not mean that users will not experience performance differences when upgrading to NAV 2018. How a customer solution will perform depends on the application used and the size of the database. As described in the blog post by Alex Addressing Performance Problem in Dynamics NAV and Dynamics 365 Business Central the addition of charts and tiles on some standard application pages can have a significant impact on performance.

In summary, there is nothing to indicate that there is a significant performance regression in NAV 2018. Let me know if you think otherwise and have an application that you would like to benchmark.

Dynamics NAV Load Test Framework Updated for NAV 2018

I just updated the the Dynamics NAV Load Test Framework for NAV 2018. The changes are mostly due to simplification of the demo application, like record number lookups that are changed to name lookups. There are also a few extra confirmation dialogs that need to be handled. The Small Business role center pages have changed, so I refactored the scenarios to use the Purchasing Agent role center. Finally, the test assemblies have been updated the the latest version which is available in the NAV 2018 downloads TestAssemblies folder.

You can see all the changes here.

I have been running a few comparisons with NAV 2016 using the Nav Docker images. I will post some results soon. Stay tuned.


Creating a NAV Server Availability Set using the Azure Load Balancer

This post describes the steps needed to setup NAV Virtual Machines in an Availability Set behind an Azure Load Balancer. This provides high availability for an NAV Server and simple load distribution. Before reading you should already be familiar with the NAV Azure Image, the NAV Demo Environment and the Azure Resource Manager. You can read more about the Load Balancer here: Azure Load Balancer Overview

The following Azure PowerShell script creates an Azure Resource Group with two NAV Virtual Machines in an Availability Set and a Load Balancer with rules configured for the NAV demo environment on the Dynamics NAV 2016 gallery image.

Before running the script you need to be connected to your Azure Subscription using the Login-AzureRmAccount cmdlet and you need to update the $testName variable to something unique and meaningful. The script will prompt for the admin credentials for the virtual machines to be created.

When the script completes and the Virtual Machines are created, you can then connect to the virtual machines using via RDP using the Azure Portal and run the “Initialize Virtual Machine” script to create the demo environment. When prompted for the cloud service name you should provide the FQDN for the Load Balancer PublicIP, the FQDN is displayed at the end of running the script. If you are using self-signed certificates you can use the certificate generated for the first virtual machine, when running the script on the second virtual machine.

The Load Balancer has rules that enable requests to the default site on Port 80, the NAV Web Client on port 443 (HTTPS) and the NAV Client Service on port 7046. These ports works with the NAV demo environment on the Dynamics NAV 2016 gallery image.

The Azure Load Balancer distributes requests between the two virtual machines. The Load Balancer rules for port 443 and port 7046 are configured with session persisitence so that once a client creates a session with on of the virtual machines the load balancer continues to direct requests from the client to that virtual machine where the NAV client session has been created.


Here is the script which is hosted in a Gist:


$testName = "unique-resource-name"
$resourceGroupName = $testName
$location = "northeurope"
$domainName = $testName
$subnetName = "Subnet-1"
$publisher = "MicrosoftDynamicsNAV"
$offer = "DynamicsNAV"
$sku = "2016"
$version = "latest"
$cred = Get-Credential
New-AzureRmResourceGroup -Name $resourceGroupName -Location $location
$vip = New-AzureRmPublicIpAddress -ResourceGroupName $resourceGroupName -Name "PublicIP1" `
-Location $location -AllocationMethod Dynamic -DomainNameLabel $domainName
$subnet = New-AzureRmVirtualNetworkSubnetConfig -Name $subnetName `
-AddressPrefix "10.0.64.0/24"
$vnet = New-AzureRmVirtualNetwork -Name "VNET" `
-ResourceGroupName $resourceGroupName `
-Location $location -AddressPrefix "10.0.0.0/16" -Subnet $subnet
$subnet = Get-AzureRmVirtualNetworkSubnetConfig -Name $subnetName -VirtualNetwork $vnet
$feIpConfig = New-AzureRmLoadBalancerFrontendIpConfig -Name $testName -PublicIpAddress $vip
$inboundNatRule1 = New-AzureRmLoadBalancerInboundNatRuleConfig -Name "RDP1" `
-FrontendIpConfiguration $feIpConfig `
-Protocol TCP -FrontendPort 3441 -BackendPort 3389
$inboundNatRule2 = New-AzureRmLoadBalancerInboundNatRuleConfig -Name "RDP2" `
-FrontendIpConfiguration $feIpConfig `
-Protocol TCP -FrontendPort 3442 -BackendPort 3389
$beAddressPool = New-AzureRmLoadBalancerBackendAddressPoolConfig -Name "LBBE"
$healthProbe = New-AzureRmLoadBalancerProbeConfig -Name "HealthProbe" `
-RequestPath "Default.aspx" -Protocol http -Port 80 `
-IntervalInSeconds 15 -ProbeCount 2
$lbrule1 = New-AzureRmLoadBalancerRuleConfig -Name "HTTP" `
-FrontendIpConfiguration $feIpConfig -BackendAddressPool $beAddressPool `
-Probe $healthProbe -Protocol Tcp -FrontendPort 80 -BackendPort 80
$lbrule2 = New-AzureRmLoadBalancerRuleConfig -Name "HTTPS" `
-FrontendIpConfiguration $feIpConfig -BackendAddressPool $beAddressPool `
-Probe $healthProbe -Protocol Tcp -FrontendPort 443 -BackendPort 443 -LoadDistribution SourceIPProtocol
$lbrule3 = New-AzureRmLoadBalancerRuleConfig -Name "NAV" `
-FrontendIpConfiguration $feIpConfig -BackendAddressPool $beAddressPool `
-Probe $healthProbe -Protocol Tcp -FrontendPort 7046 -BackendPort 7046 -LoadDistribution SourceIPProtocol
$lbrule4 = New-AzureRmLoadBalancerRuleConfig -Name "NAVHELP" `
-FrontendIpConfiguration $feIpConfig -BackendAddressPool $beAddressPool `
-Probe $healthProbe -Protocol Tcp -FrontendPort 49000 -BackendPort 49000
$alb = New-AzureRmLoadBalancer -ResourceGroupName $resourceGroupName `
-Name "ALB" -Location $location -FrontendIpConfiguration $feIpConfig `
-InboundNatRule $inboundNatRule1,$inboundNatRule2 `
-LoadBalancingRule ($lbrule1,$lbrule2,$lbrule3,$lbrule4) -BackendAddressPool $beAddressPool `
-Probe $healthProbe
$nic1 = New-AzureRmNetworkInterface -ResourceGroupName $resourceGroupName `
-Name "nic1" -Subnet $subnet -Location $location `
-LoadBalancerInboundNatRule $alb.InboundNatRules[0] `
-LoadBalancerBackendAddressPool $alb.BackendAddressPools[0]
$nic2 = New-AzureRmNetworkInterface -ResourceGroupName $resourceGroupName `
-Name "nic2" -Subnet $subnet -Location $location `
-LoadBalancerInboundNatRule $alb.InboundNatRules[1] `
-LoadBalancerBackendAddressPool $alb.BackendAddressPools[0]
New-AzureRmAvailabilitySet -ResourceGroupName $resourceGroupName `
-Name "AVSet" -Location $location
$avset = Get-AzureRmAvailabilitySet -ResourceGroupName $resourceGroupName -Name "AVSet"
New-AzureRmStorageAccount -ResourceGroupName $resourceGroupName `
-Name $testName -Location $location -Type Standard_LRS
Get-AzureRmStorageAccount -ResourceGroupName $resourceGroupName
[array]$nics = @($nic1,$nic2)
For ($i=0; $i -le 1; $i++) {
$vmName = "$testName-w$i"
$vmConfig = New-AzureRmVMConfig -VMName $vmName -VMSize "Standard_DS1" `
-AvailabilitySetId $avSet.Id |
Set-AzureRmVMOperatingSystem -Windows -ComputerName $vmName `
-Credential $cred -ProvisionVMAgent -EnableAutoUpdate |
Set-AzureRmVMSourceImage -PublisherName $publisher -Offer $offer -Skus $sku `
-Version $version |
Set-AzureRmVMOSDisk -Name $vmName -VhdUri "https://$testName.blob.core.windows.net/vhds/$vmName-os.vhd&quot; `
-Caching ReadWrite -CreateOption fromImage |
Add-AzureRmVMNetworkInterface -Id $nics[$i].Id
New-AzureRmVM -ResourceGroupName $resourceGroupName -Location $location `
-VM $vmConfig
}
$ipAddr = Get-AzureRmPublicIpAddress -ResourceGroupName $resourceGroupName
$ipAddr.IpAddress
$ipAddr.DnsSettings.Fqdn
Find-AzureRmResource -ResourceGroupNameContains $resourceGroupName | Select Name, ResourceType
<#
Remove-AzureRmResourceGroup -Name $resourceGroupName
#>

Differences between NAV Unit Tests and Performance Tests

A recent question on NAVLoadTest that asked about a possible “Combined Unit & load- testing module” using the NAV Application Test Toolset got me thinking about the differences between Application “Unit Tests” and Performance Tests. There are some important differences in the goals and the design of Performance Tests like the NAVLoadTest scenarios and Application Tests written using the NAV Application Test Toolset .

  1. Goals:
    1. Application Tests are designed to verify correct functionality of a module.
    2. Performance Tests are designed to measure some aspect of system performance.
  2. Scope:
    1. Application Tests are designed to test individual C/AL objects and methods in isolation. The tests are executed in the NAV Server only so there is no client-server communication involved.
    2. Performance Tests test end-to-end user interactions. They run using the NAV client service which is hosted in IIS. This means that the tests measure the resources consumed by the client layer, the NAV Server, SQL Server and the communications between those layers.
  3. Data Isolation:
    1. Application Tests are designed to be data-independent and be executed in isolation from other tests. Any changes done to the database through running of tests from the Test Tool are automatically rolled back using the Test Isolation feature.
    2. Performance Tests are dependent on existing data, create persistent data and are impacted by the data created by other tests. One of the goals of the Load Tests Scenarios is to observe how the test scenario performance changes as the dataset grows. One of the hardest parts of writing load test scenarios is ensuring that the test continue to run predictably as the dataset changes.
  4. Test Verification
    1. Application Test tests follow the “Arrange – Act – Assert” (see http://c2.com/cgi/wiki?ArrangeActAssert) pattern of unit tests. They ensure the state has not been changed unexpectedly during the test.
    2. Performance Tests have no way of controlling the initial state as other tests can be running concurrently on the same database. They must be resilient to changes in data and possible errors that occur during test execution and handle them appropriately as a user might. For example the “another user has locked the record” error occurs frequently in load tests when there is a concurrent user load.

There are probably more differences that I didn’t cover. When writing performance tests you may find it easy to start with the scenarios used in some application tests but I find that whenever I attempt to reuse an existing test as a performance test I end up needing to rewrite the test to cover situations that don’t occur in the original test.

Recent Updates to the NAVLoadTest Repository

After returning from Directions I have made 2 updates to the NAVLoadTest repo.

The first change the result of a request made during the Directions workshop to use lookup controls when selecting records randomly instead of opening list pages. The InvokeCatchLookup extension method invokes the Lookup SystemAction and expects to catch a Lookup Form. See “Feature/use control lookups”.

The second change is to add the basic Small Business User scenarios to the project to demonstrate how to use other role centres and pages.  See “Feature/small business scenarios”

NAV Performance Test Toolkit Supports NAV 2016

I have just spent 3 days at Directions EMEA 2015 where I presented the NAV Performance Test Toolkit with Freddy and did a workshop on writing performance tests. The workshop had good attendance and I got some good feedback and suggestions for improvements. You can see an issue created during the session here: Issues.

I have recently updated the NAVLoadTest repository with support for NAV 2016. The changes for NAV 2016 include the references to the updated NAV Client Framework Library and some changes to the authentication code. The Client Framework library appears to have had some significant updates and now uses JSON over HTTP instead of WCF. Take a look at the communications while running the tests using Fiddler if you are interested to see how that works.

Please add your requests for improvements and other feedback to the  NAVLoadTest issues list. This is the main repository for the toolkit and will always contain the latest version of the toolkit. The other repositories won’t change so often as they are used for demonstrations and hands-on labs and need to be kept in synch with the other demonstration materials.

There are a few other improvements made recently, in particular a change that allows you to add more than 5 records to a list (see the NAVLoadTest Commits for details).

It was great to hear from so many people that are using the toolkit. I hope to be able to push some more improvements soon. Stay tuned.

How to Write NAV Load Tests Scenarios Using Visual Studio

I created 2 videos about writing simple load test scenarios for Dynamics NAV using Visual Studio. The first video covers a simple scenario for opening and closing a page. The second video shows how to write a scenario to create a Purchase Order. Both examples also show how to add tests to the Visual Studio Load Test.

The videos are available on You Tube:

Monitoring & Diagnosing Microsoft Dynamics NAV Server Performance

At NAV Tech Days 2014, Dmytro Sitnik and I presented “Monitoring & Diagnosing Microsoft Dynamics NAV Server Performance”. The presentation and video are now available for download at mibuso.com.

The presentation was a great opportunity to see how NAV developers are interested in tools to analyze Dynamics NAV performance. There were also a lot of tough questions afterwards 🙂

What I learnt is that having a few performance counters and the infrastructure for diagnosing NAV performance is not enough. The “proper” way to create benchmarks for a system is to collect data from the performance counters over a statistically significant period of “normal” usage and then analyze the data to define the expected metrics for normal usage. This is time consuming and I think most NAV developers would like to have an easier way of determining whether their system is performing normally and to quickly identify any obvious issues.

There are tools for analyzing SQL server performance that provide a pre-defined set of “normal” performance metrics and configuration parameters to identify any obvious issues. This is not a comprehensive performance analysis but it makes a good starting point for investigations.

What is needed for NAV is a set of guidelines for NAV performance counters and configuration parameters. I will be collecting data from my own investigations to build a set of guidelines.

Let me know if you have any comments or suggestions.